Pipeline debugger
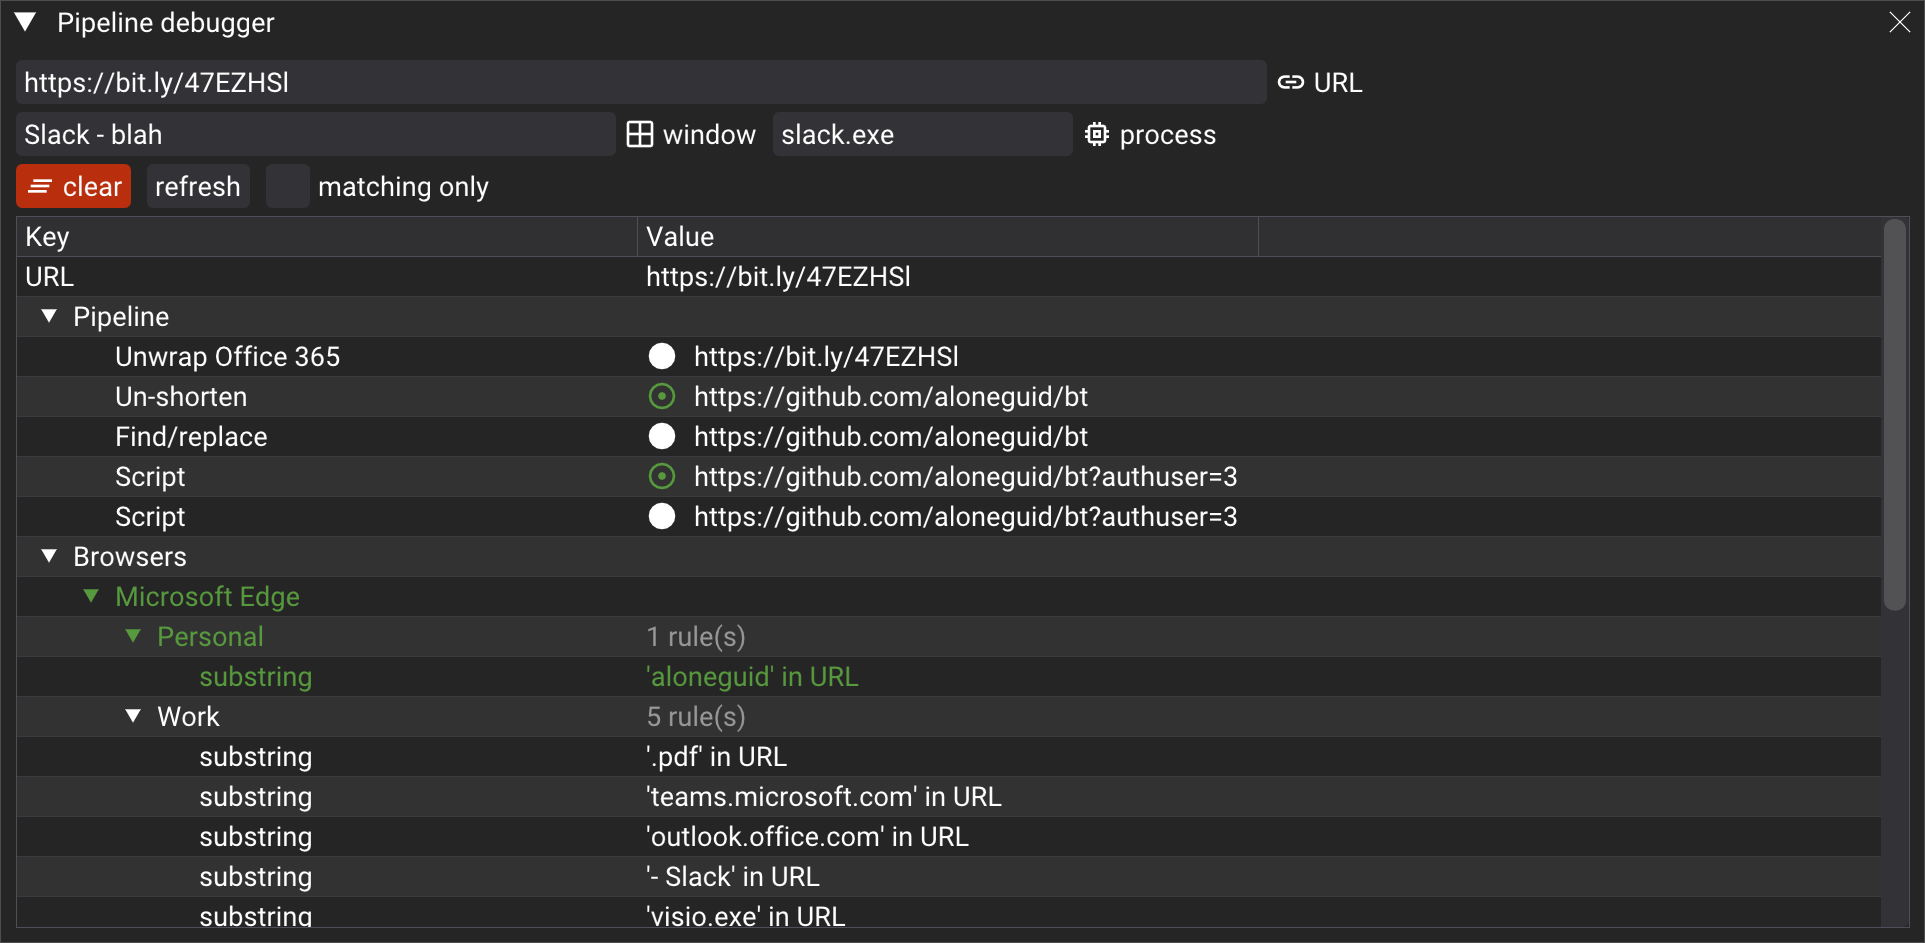
Pipeline debugger is introduced in v4.1.0 and provides a way to get an overall picture of how Browser Tamer processes URLs and what rules are applied to them as a single unified picture.
The debugger is available from the Tools menu.

Top part of the debugger allows you to enter a URL, and optionally window title and process name. This is useful for debugging rules that are based on these parameters.
The bottom part shows several sections:
Pipeline - shows the URL processing pipeline, including unshortening, unwrapping, substitutions, and custom scripts. "Value" column shows how a pipeline step has transformed the URL. If a transformation was performed, the "Value" column will show the new URL and a green circular icon.
Browsers - shows the list of browsers, their profiles, and their rules that were applied to the URL. If a rule was matched, it is highlighted in green. You can also tick "matching only" checkbox to see only rules that were matched.